About the Data Matching Component | ||
| ||
The data being matched can be from a parsed text file, or you can use arrays (one-dimensional array or a slice of a multi-dimensional array) produced from components earlier in the simulation process flow. The parsed text file uses the Data Exchanger component functionality to parse series files or tables of data. A series file contains data that are spread out in easily identifiable and repeatable intervals. For more information about the Data Exchanger, see Data Exchanger Component.
The Data Matching component supports numerous functions, such as sum of the absolute difference and sum of the squared difference. In addition, you can add customized functions (see Using Custom Functions).
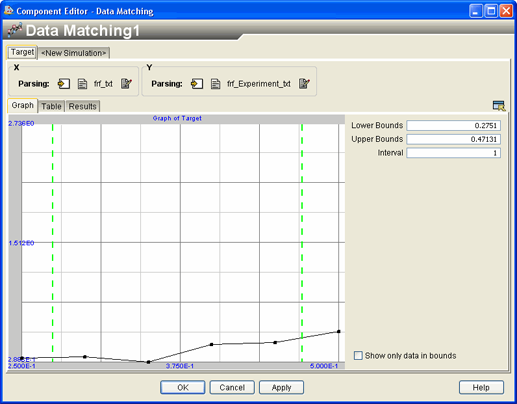
The figure below shows the Data Matching component with a data set.
-
Data Sets. The Data Sets area includes a tab for each of the current data sets. The target data set is always shown because it is the data set against which the data are being matched. Typically, the target data are experimental results, previous real-world observations, or simulation results generated by a higher fidelity code. The remaining data sets are the simulations that are compared to the target.
-
Data Sources. Each data set is constructed from two data sources: one for the X-values and one for the Y-values. These data sources can be a defined interval, the contents of a parsed text file, or an array produced by another component. After adding a data set, you can click the
 button to edit the data source.
 -
Graph. Each data set can be viewed graphically. In addition, in this global view of the data you can adjust data filters by using the dashed vertical lines on the graph or by changing the Lower Bounds, Upper Bounds, and Interval values.
-
Table. Each data set can be viewed in a table format. In this view, you can change the data by changing the Lower Bounds, Upper Bounds, and Interval values.
-
Results. You can select the functions to be calculated at run time. These functions produce the results of the data matching. For information about functions, see Selecting Functions.
To start the Data Matching Component Editor, double-click the Data Matching component icon  . When you have finished configuring the Data Matching Component Editor, click OK to close the editor. For more information about inserting components and accessing component editors, see Working with Components in the Isight User’s Guide.