Simulation Equations | ||
| ||
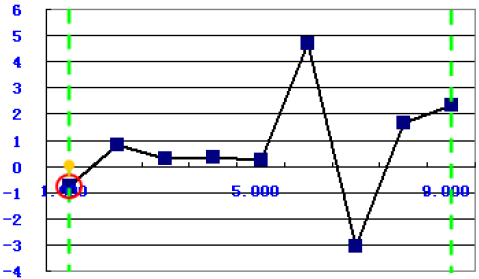
Start Position
The function uses the following equation:
to calculate the x start value of the simulation data in the range of Yi (marked in red) between the two green borderlines, as shown in the following graph:
![]()
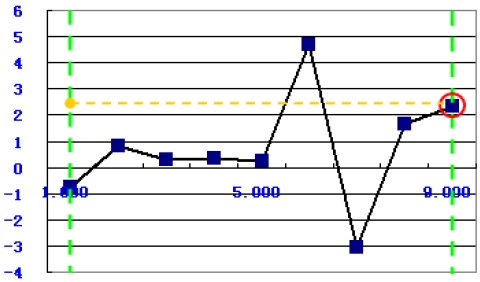
End Position
The function uses the following equation:
to calculate the x end value of the simulation data in the range of Yi (marked in red) between the two green borderlines, as shown in the following graph:
![]()
Number of Data Points
The function uses the following equation:
to calculate the number of the data points (marked in red) between the two green borderlines. In the following example, the result is 9.
![]()
Minimum X Value
The function uses the following equation:
to calculate the minimum value of the x-axis between the two green borderlines, as shown in the following graph:
![]()
Maximum X Value
The function uses the following equation:
to calculate the maximum value of the x-axis between the two green borderlines, as shown in the following graph:
![]()
Minimum Y Value
The function uses the following equation:
to calculate the minimum value of the y-axis between the two green borderlines, as shown in the following graph:

![]()
Maximum Y Value
The function uses the following equation:
to calculate the maximum value of the y-axis between the two green borderlines, as shown in the following graph:
![]()
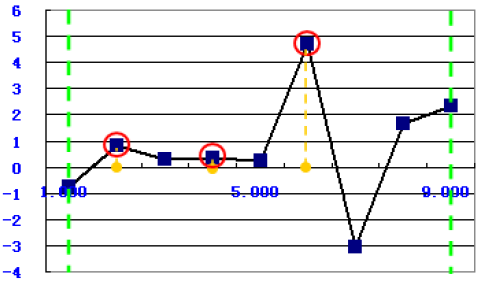
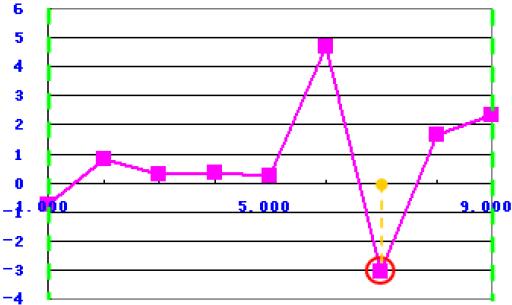
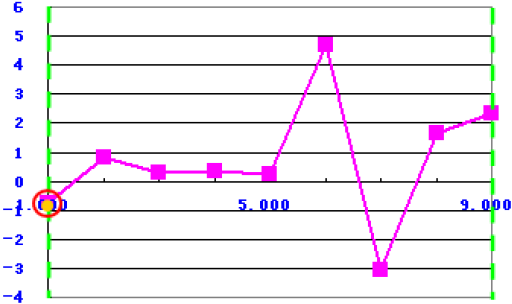
Position of Minimum Y Value
The function uses the following equation:
to calculate the minimum value's position of the y-axis between the two green borderlines, as shown in the following graph:
![]()
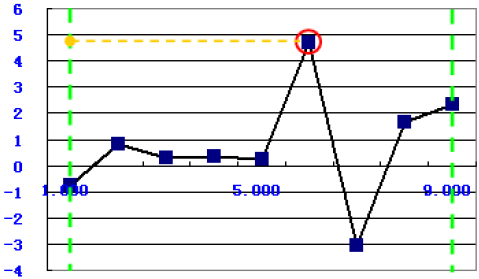
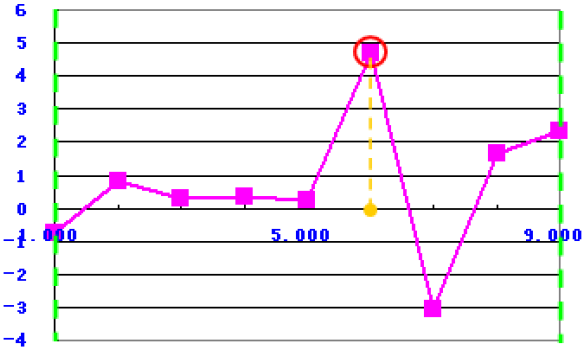
Position of Maximum Y Value
The function uses the following equation:
to calculate the maximum value's portion of the y-axis between the two green borderlines, as shown in the following graph:
![]()
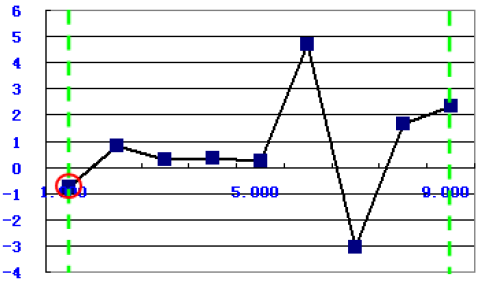
Y Value of Minimum X Value
The function uses the following equation:
to calculate the y value of the minimum position target x between the two green borderlines, as shown in the following graph:
![]()
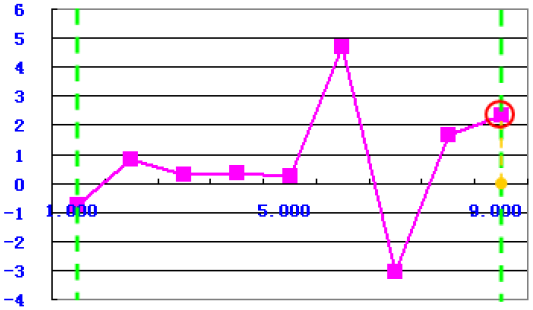
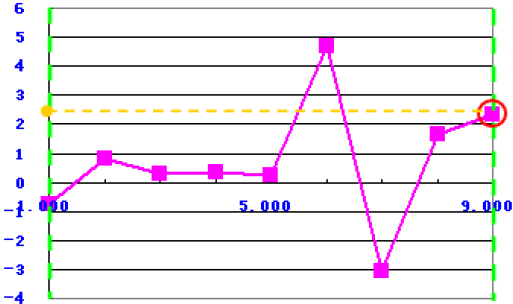
Y Value of Maximum X Value
The function uses the following equation:
to calculate the y value of the maximum position x between the two green borderlines, as shown in the following graph:
![]()
Mean
The function uses the following equation:
to calculate the mean value of the y-axis.
![]()
Sigma
The function uses the following equation:
to calculate the sigma of the y-axis.
![]()
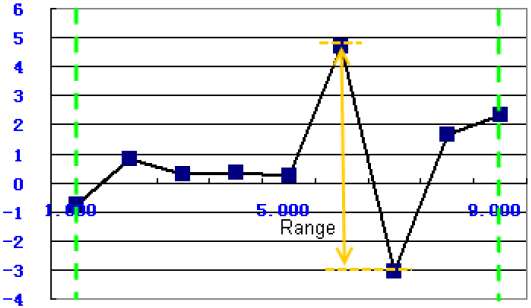
Range
The function uses the following equation:
to calculate the range of the y-axis between the two green borderlines, as shown in the following graph:
![]()
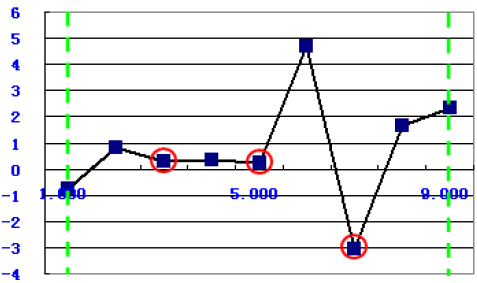
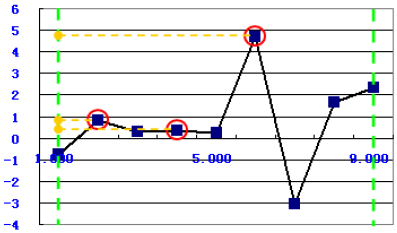
Number of Troughs
The function uses the following equation:
to calculate the number of the trough points (marked in red) between the two green borderlines. In the following example, the result is 3.
![]()
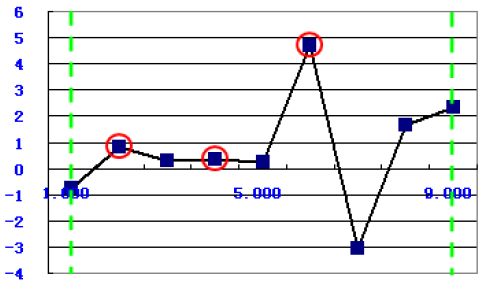
Number of Peaks
The function uses the following equation:
to calculate the number of the peak points, marked in red, between the two green borderlines. In the following example, the result is 3.
![]()
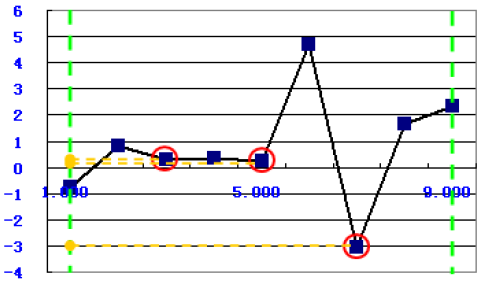
Trough Values
The function uses the following equation:
to calculate the values of the trough points between the two green borderlines as an array, as shown in the following graph:
![]()
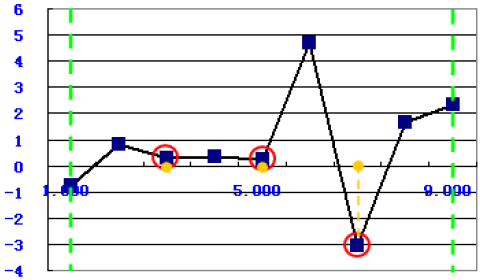
Trough Positions
The function uses the following equation:
to calculate the positions of the trough points between the two green borderlines as an array, as shown in the following graph:
![]()
Peak Values
The function uses the following equation:
to calculate the values of the peak points between the two green borderlines as an array, as shown in the following graph:
![]()
Peak Positions
The function uses the following equation:
to calculate the values of the trough points between the two green borderlines as an array: