Introduction to Taguchi Dynamic Analysis | ||
| ||
A signal factor is introduced when the system must be designed to accommodate a user-adjustable input and achieve the user-expected results, which introduces a dynamic characteristic into the problem. For example, a thermostat must be calibrated such that the measured temperature matches the user set desired temperature. In addition, the sensitivity of the user adjustment should be constant, for easy control by the user, and be insensitive to noise (a robust dynamic system).
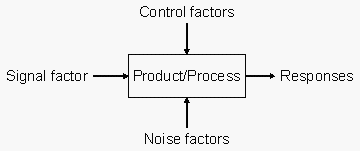
The Taguchi P-Diagram is shown in the following figure, including the three types of factors as inputs to the system that influence the responses. The specific goal of Taguchi analysis with dynamic characteristics, when a signal factor is included, is to identify a design with:
-
linear signal/response relationship (constant sensitivity of user adjustment)
-
minimized variability around the linear signal/response relationship

The experimental data are gathered for a dynamic system by repeating the product array described in Taguchi Robust Design for each signal factor level. Therefore, the number of experiments for a dynamic system is the product of the number of control experiments, the number of noise experiments, and the number of signal factor levels.
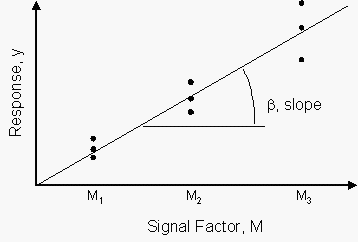
An example signal factor-response relationship is shown in the figure below. The multiple points at each signal factor level are a result of variation caused by noise factors. The relationship between the response and signal factor can be modeled as where is the response, is the signal factor, and is the slope of the line fit to the signal/response data.

To measure both the linearity of the signal-response relationship and the variability of noise around this modeled relationship, a dynamic signal-to-noise ratio is calculated for each experiment run (each control array experiment). To calculate the dynamic signal-to-noise ratio, the type of the signal-response relationship must first be defined. The following relationships exist:
-
Zero Point Proportional. The relationship between the signal factor and response passes through zero (zero input leads to zero output). One good example of this relationship is a weighing system to be designed and calibrated. If no weight is on the scale, the measurement is zero.
-
Reference Point Proportional. The relationship between the signal factor and the response passes through a reference point. This type is used when the relationship does not pass through zero or when the signal values are far from zero. This type can be used if the relationship can be calibrated to a known standard, as with oven controls where one setting is calibrated to a specific temperature.
-
General Linear Equation. This relationship is used when the relationship between the signal factor and the response is not known to pass through zero and no reference point is known. This is the most general case. Use the other types whenever possible. This type can be useful; however, when signal levels are close together and far from zero, with no known reference point. With this type, a linear fit to the data will be used to assess the signal factor/response relationship.