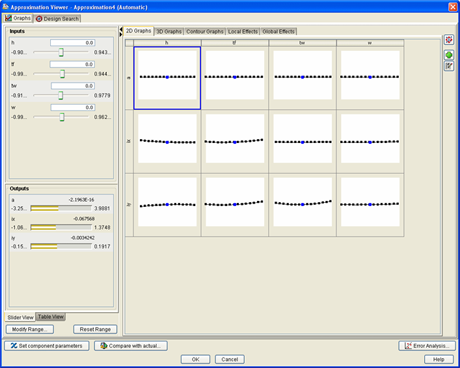
Approximation Graph Display and Control | ||
| ||
You can use the Slider View shown in the following figure to modify the approximation input values by moving the input sliders to the left or to the right. The output value bars change based on the input values.

You can use the Table View shown in the following figure to look at the graph created from specific input/output combinations. In addition, you can enter different specific input points quickly and observe the resulting behavior. You can also sort the table rows and easily find the largest and smallest output parameters for a given design point.
